The geospatial products described and distributed here depict the probability of high-severity fire, if a fire were to occur, for several ecoregions in the contiguous western US.
The ecological effects of wildland fire – also termed the fire severity – are often highly heterogeneous in space and time. This heterogeneity is a result of spatial variability in factors such as fuel, topography, and climate (e.g. mean annual temperature). However, temporally variable factors such as daily weather and climatic extremes (e.g. an unusually warm year) also may play a key role.
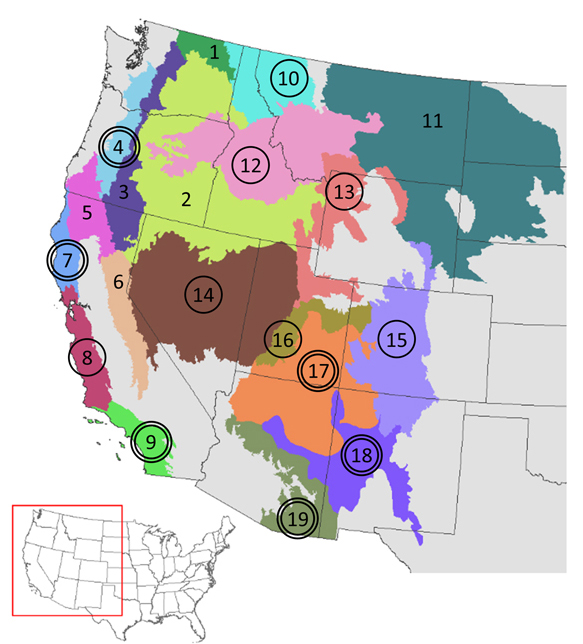
Scientists from the US Forest Service Rocky Mountain Research Station and the University of Montana conducted a study in which observed data were used to produce statistical models describing the probability of high-severity fire as a function of fuel, topography, climate, and fire weather. Observed data from over 2000 fires were used to build individual models for each of 19 ecoregions in the contiguous US (see Fig. 1 below). High-severity fire was measured using a fire severity metric termed the relativized burn ratio, which uses pre- and post-fire Landsat imagery to measure fire-induced ecological change. Fuel included pre-fire metrics of live fuel amount such as NDVI. Topography included factors such as slope and potential solar radiation. Climate summarized 30-year averages of factors such as mean summer temperature that spatially vary across the study area. Lastly, fire weather incorporated temporally variable factors such as daily and annual temperature.
In turn, these statistical models were used to generate "wall-to-wall" maps depicting the probability of high-severity fire, if a fire were to occur, for 13 of the 19 ecoregions (see Fig. 2 for example). Maps were not produced for ecoregions in which model quality was deemed inadequate. All maps use fuel data representing the year 2016 and therefore provide a fairly up-to-date assessment of the potential for high-severity fire. For those ecoregions in which the relative influence of fire weather was fairly strong (n=6), two additional maps were produced, one depicting the probability of high-severity fire under moderate weather and the other under extreme weather. An important consideration is that only pixels defined as forest were used to build the models; consequently maps exclude pixels considered non-forest.
Sean Parks
Aldo Leopold Wilderness Research Institute
US Forest Service, Rocky Mountain Research Station
sean.parks@usda.gov
Ecoregion
- Okanagan Ecoregion
- Columbia Plateau Ecoregion
- East Cascades Ecoregion
- West Cascades Ecoregion (zip file, 591 MB)
- Klamath Ecoregion
- Sierra Nevada Ecoregion
- California North Coast Ecoregion (zip file, 278 MB)
- California Central Coast Ecoregion (zip file, 57 MB)
- California South Coast Ecoregion (zip file, 127 MB)
- Canadian Rockies Ecoregion (zip file, 358 MB)
- Northern Great Plains Ecoregion
- Middle Rockies Ecoregion (zip file, 612 MB)
- Utah - Wyoming Rockies Ecoregion (zip file, 178 MB)
- Great Basin Ecoregion (zip file, 348 MB)
- Southern Rockies Ecoregion (zip file, 534 MB)
- Utah High Plateaus Ecoregion (zip file, 169 MB)
- Colorado Plateau Ecoregion (zip file, 852 MB)
- Arizona - New Mexico Mountains Ecoregion (zip file, 721 MB)
- Apache Highlands Ecoregion (zip file, 365 MB)
Figure 1: Of the 19 ecoregions analyzed, 13 performed at a level (AUC >=0.70) in which we felt comfortable producing maps depicting the probability of high-severity fire. These 13 ecoregions are identified by the circle (any style) and the resulting predictions are a composite (i.e. and average) of 100 independent predictions using randomly selected fire weather. The relative influence of fire weather was >=15% in six of these 13 ecoregions, which are identified by the double circle. These six ecoregions have two additional products, one depicting the probability of high-severity fire under moderate weather (i.e. the 50th percentile of the 100 independent predictions) and the other under extreme weather (i.e. the 95th percentile of the 100 independent predictions). See Parks et al. (2018) Methods for further details.
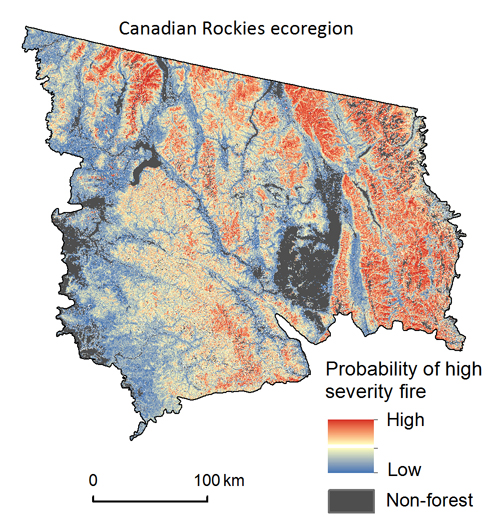
Figure 2: This map depicts the probability of high-severity fire, were a fire to occur, for the Canadian Rockies ecoregion (see Fig. 1). This raster dataset, as well as several others from different ecoregions, can be downloaded by clicking on the relevant links above.
Funding was provided by the Joint Fire Science Program